Mall Sales Excel Dashboard
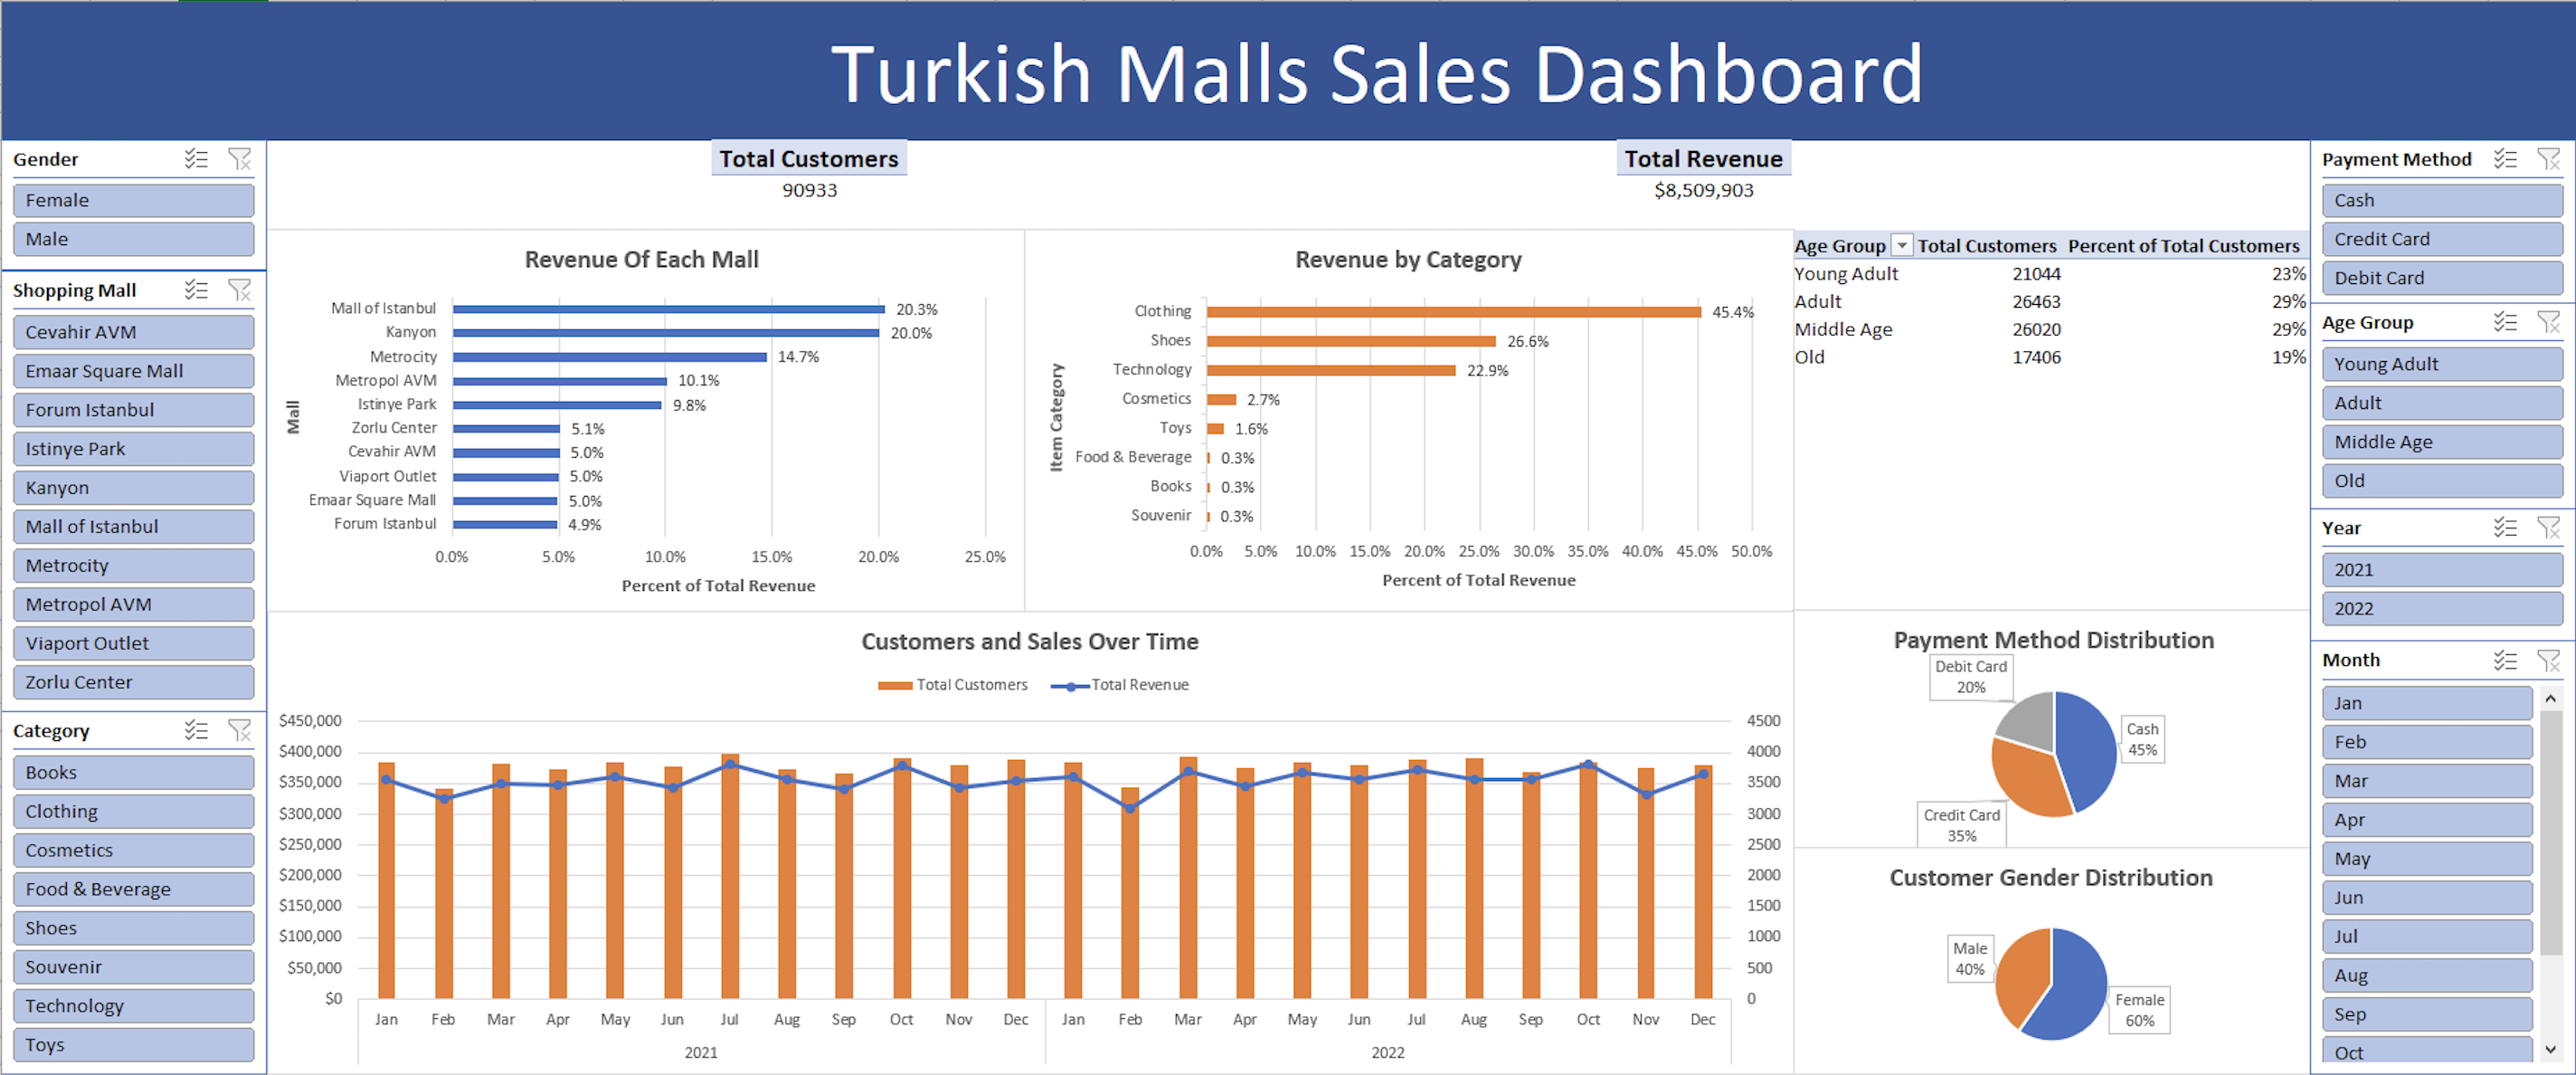
I wanted to create a sales dashboard in Excel just for fun. I went on Kaggle and found a CSV dataset that has sales data on a series of Turkish malls.
Link to Original Dataset: Click Here
Approach
- Formatted dates and filtered out rows of unnecessary data from the dataset using Pandas in a Jupyter Notebook
- Imported the CSV dataset with formatted dates to Excel and transformed it into an Excel sheet
- Perfomed further data cleaning in Excel by checking for null/duplicate rows and possible outlier values for each column
- Feature engineered new columns of data like age group, revenue and dollars in USD using existing columns
- Constructed pivot tables and pivot charts using the finalized Excel sheet
- Created the dashboard by piecing together pivot charts/tables and used slicers for interactive filtering
Link to Project: Click Here